Debugging
Debug with your browser's Developer Tools
The Developer Tools can be invoked by pressing F12 on your keyboard and offer a panel of features such as a JS console, network request traces and so on.
The Sources tab of the Developer Tools enable you to open any source file by name (Ctrl + P) as long as you are not in a production build where files are minified. This is where you can place breakpoints.
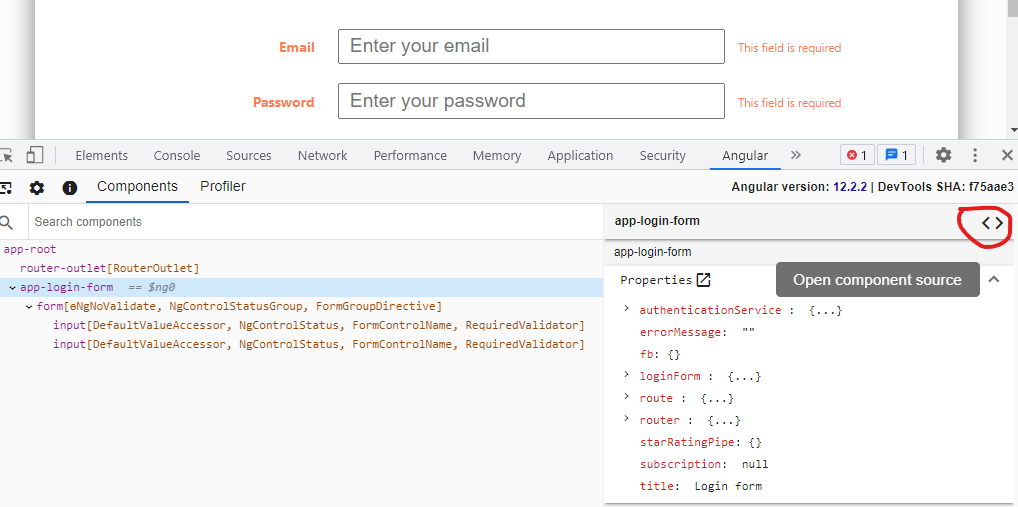
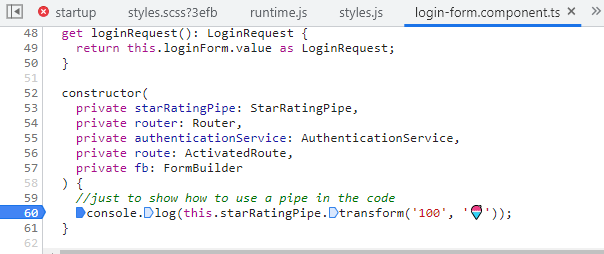
Alternatively, Angular provides a browser extension for Chrome called Angular DevTools. It adds Angular specific debugging and profiling capabilities. The following screenshot illustrates the component tree feature of Angular DevTools. When the developer clicks on the "<>" button surrounded in red, he gets access to the source code of the component where he can place breakpoints.
Debug with VSCode (only for locally served application)
VSCode allows you to natively debug your development application on Chrome or Edge. To do that, you first need to create a launch configuration for debugging. VSCode can create such a file automatically by following these steps:
- Press F5 on your keyboard or clic on create a launch.json file in the debug panel (left sidebar).
- After a quick scan of the projet, VSCode will suggest relevent debug configurations. Choose Chrome.
- A new file located in .vscode/launch.json will be created.
- Open that file and change the port from the default value to the one used by the development server (4200 is the common value).
Here is a sample .vscode/launch.json:
{
  "version": "0.2.0",
  "configurations": [
    {
      "type": "pwa-chrome",
      "request": "launch",
      "name": "Launch Chrome against localhost",
      "url": "http://localhost:4200",
      "webRoot": "${workspaceFolder}"
    }
  ]
}
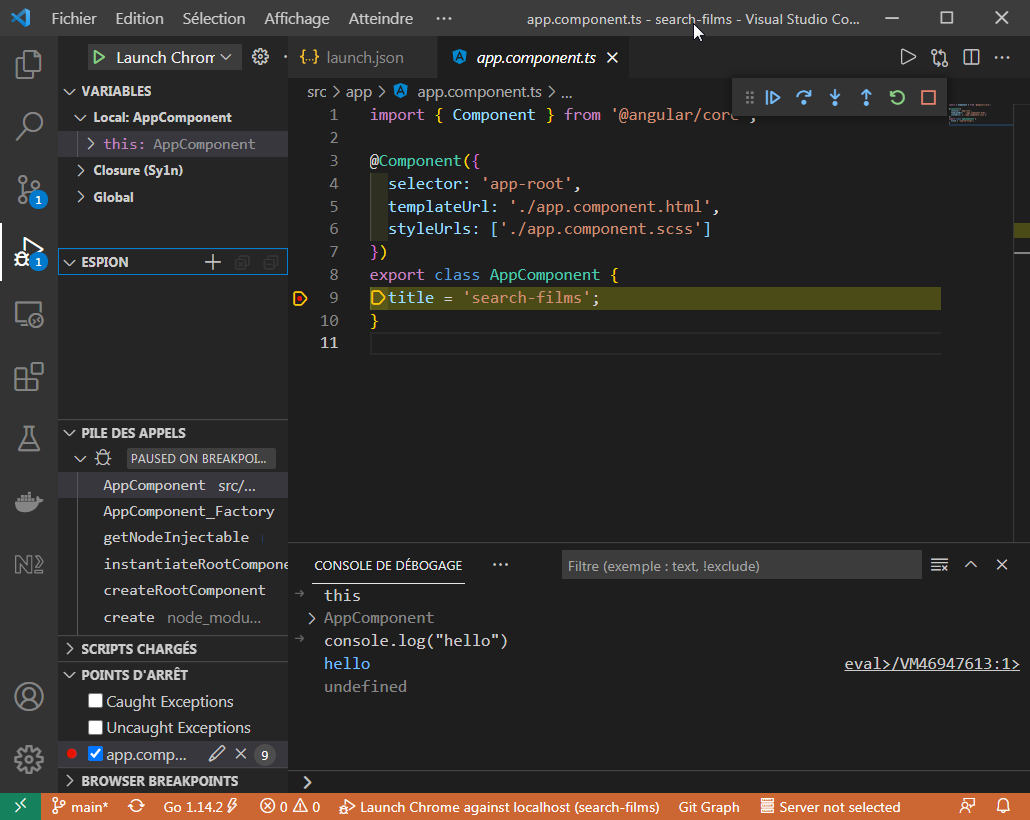
Once you have a launch configuration and a running development server, press F5. This will open your app in a new browser window and enable debugging features in VSCode. To verify that, please add a breakpoint in the app component and launch a debug session. The debugger should break on your breakpoint.